John Arneson | graphic designer
9.1.14
40 DAYS!
A few people have asked about training progress lately so I thought I'd share my 'gut check' data report. Over the last nine months I've logged just over 500 training hours with a mileage breakdown of: Swim 204mi, Bike 5,538mi, Run 592mi. For the data geeks, my Training Stress Score (TSS) points (based on effort - power, heart rate, speed etc) is near 30,000. Last week’s training topped out at 22 hours with mileage totals at: swim 7mi, bike 285mi, run 25mi. My TSS was at 1,300 and total calories burned 15,986.
I'm into peak training now and it's a bit like the movie Groundhog Day. Wake up, work out, eat, day job, lunch-time work out, eat, work, eat, couple down hours, sleep. Repeat. There should be laundry in there somewhere, but the laundry fairy (my lovely wife) somehow keeps my closet stocked with workout clothes. With 1,500+ miles of training left, the next four weeks are a big fitness build followed by a taper into race day.
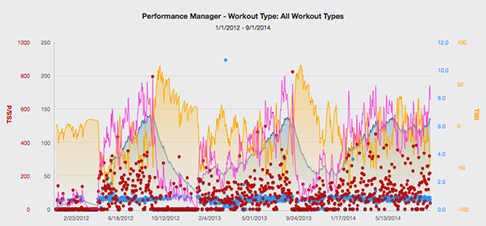
Below is a three year overview (2012-2014) of training data from TraininPeaks.com. Each hump represents the build-up in training to my ‘A’ races (IMWI ‘12, IMWI ‘13, Kona ‘14). The blue line represents fitness, pink is daily training stress and yellow is fatigue. The goal is to elevate the blue gradually over time (as high as possible) and on race day have the pink training load meet the yellow fatigue line. A bit of magic that leaves the athlete well rested and race ready!

Every donation helps.
http://fundraise.worldbicyclerelief.org/JohnArneson